Le possibilità di realizzare un profitto sul mercato Forex OTC sono indissolubilmente legate al rischio di incorrere in una perdita. Nota: i clienti che fanno trading di CFD non possiedono né hanno altri diritti sulle attività sottostanti.
With real-time, actionable macro-economic data, TC Economic Calendar enables you to easily monitor, anticipate and act on potentially market-moving events.
Filter the economic events of 38 different countries by country or expected significance, track each event in real-time, or take a peek at how the event played out across the past 5 years on the price chart!
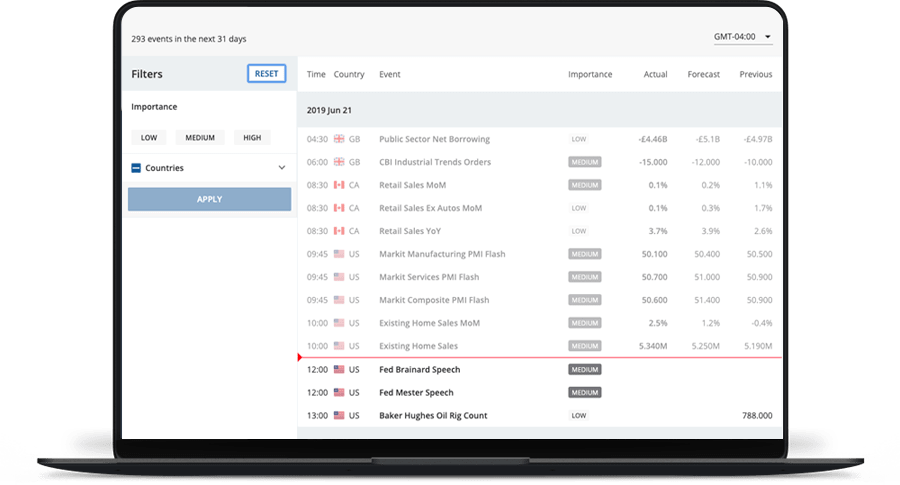
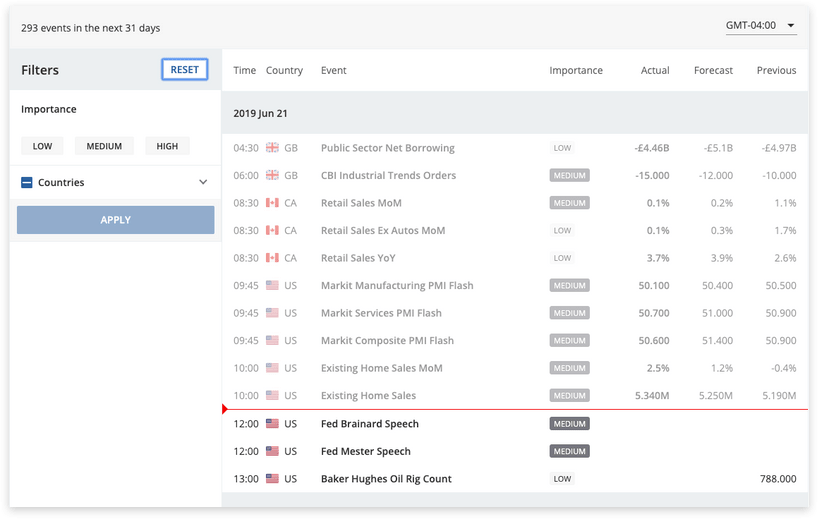
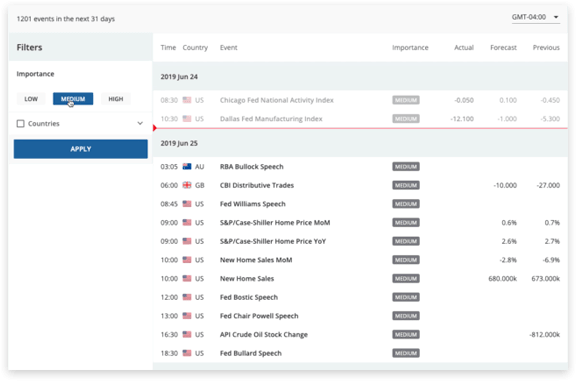
Let’s begin by exploring the calendar. Here you’ll find current and upcoming economic events listed in chronological order with a red line marking the current time. We’ll automatically detect your local timezone, but you can always switch this at the top if needed!
In the top right corner, you can chose whether you’d like to use the calendar to explore select indices or FX pairs.
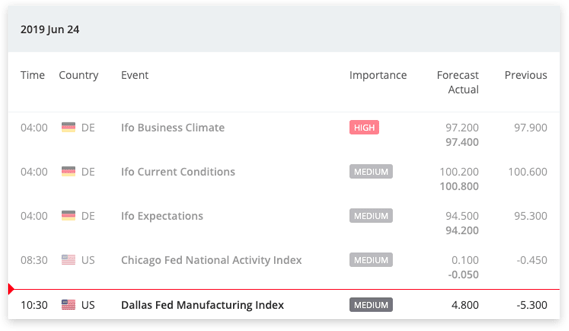
Looking at the calendar, you’ll find all the most recent information available (updated in real-time!) for each economic event including: The event title, the time it will occur, the country it takes place in, its expected impact on currencies, the forecasted values and the actual value, revision & previous value.
To the left, you’ll find the filter, where you can easily tailor your calendar to display events of interest by either country or importance.
Looking at the calendar, you’ll find all the most recent information available (updated in real-time!) for each economic event including: The event title, the time it will occur, the country it takes place in, its expected impact on currencies, the forecasted values and the actual value, revision & previous value.
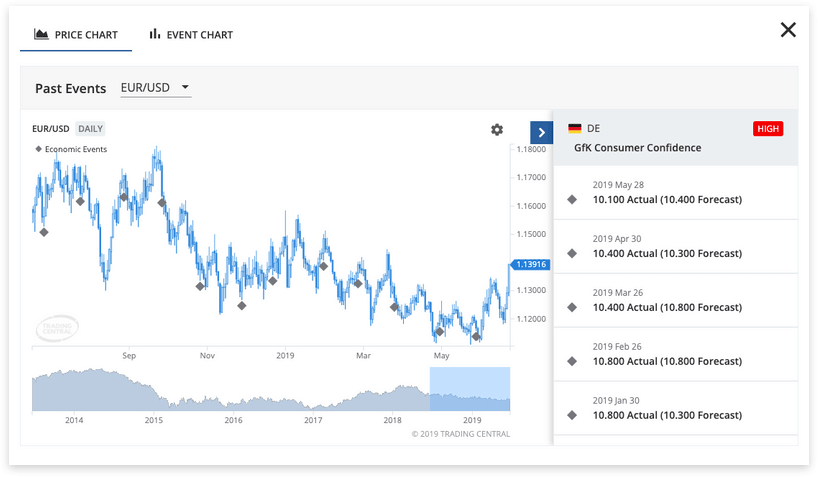
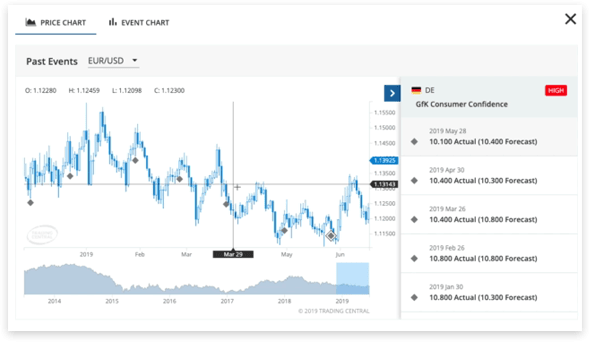
Welcome to the charts! Here you’ll find your selected economic event plotted alongside the last five years of pricing for a related index or currency pair.
You can easily switch the index or currency pairs by selecting from the dropdown list, adjust your chart display, or click on a specific historical event to zoom in for a closer look.
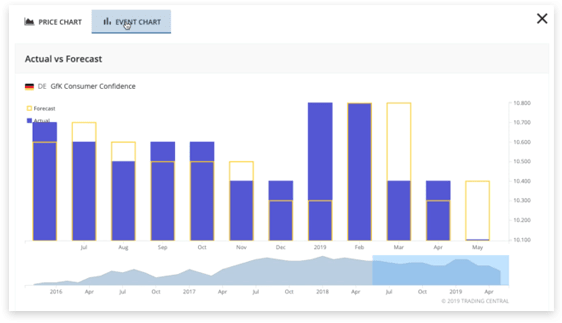
Get a clear view of the historical trend of the economic indicator by clicking on the “event chart”. Here, you’ll see how the “actual” value aligns with the original “forecasted” value for the past announcements.
In case of economic events without Actual & Forecast value, such as Governor’s speech, Event Chart will not be available.
This website is not directed at EU residents. Please let us
know how you like to proceed.
We have detected that you are visiting our site from an unsupported country. Please be advised that we don't offer our services to residents from your region.