The changes of making a profit on the Forex OTC market inextricably linked to the risk of incurring a loss. Please not: Clients trading CFDs do not own or have any other rights to the underlying assets.
The changes of making a profit on the Forex OTC market inextricably linked to the risk of incurring a loss. Please not: Clients trading CFDs do not own or have any other rights to the underlying assets.
Analyst Views provides a concise, actionable trading plan derived from the unique combination of registered market analysts and automated quantitative algorithms.
With clear trend lines, unparalleled coverage and updated analyses published throughout the trading day, Analyst Views is a powerful tool for finding new trade ideas and timing your entry/exit points.


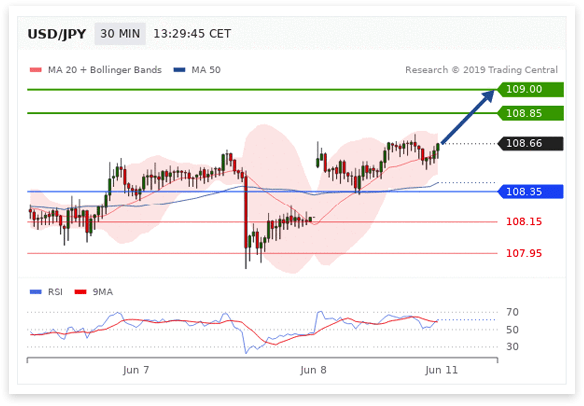
Here we are looking at a signature chart by Trading Central. There may be indicators, patterns or trend lines plotted on the price chart. This gives you a glimpse into the technical analysis methodology, but let’s focus on the output.
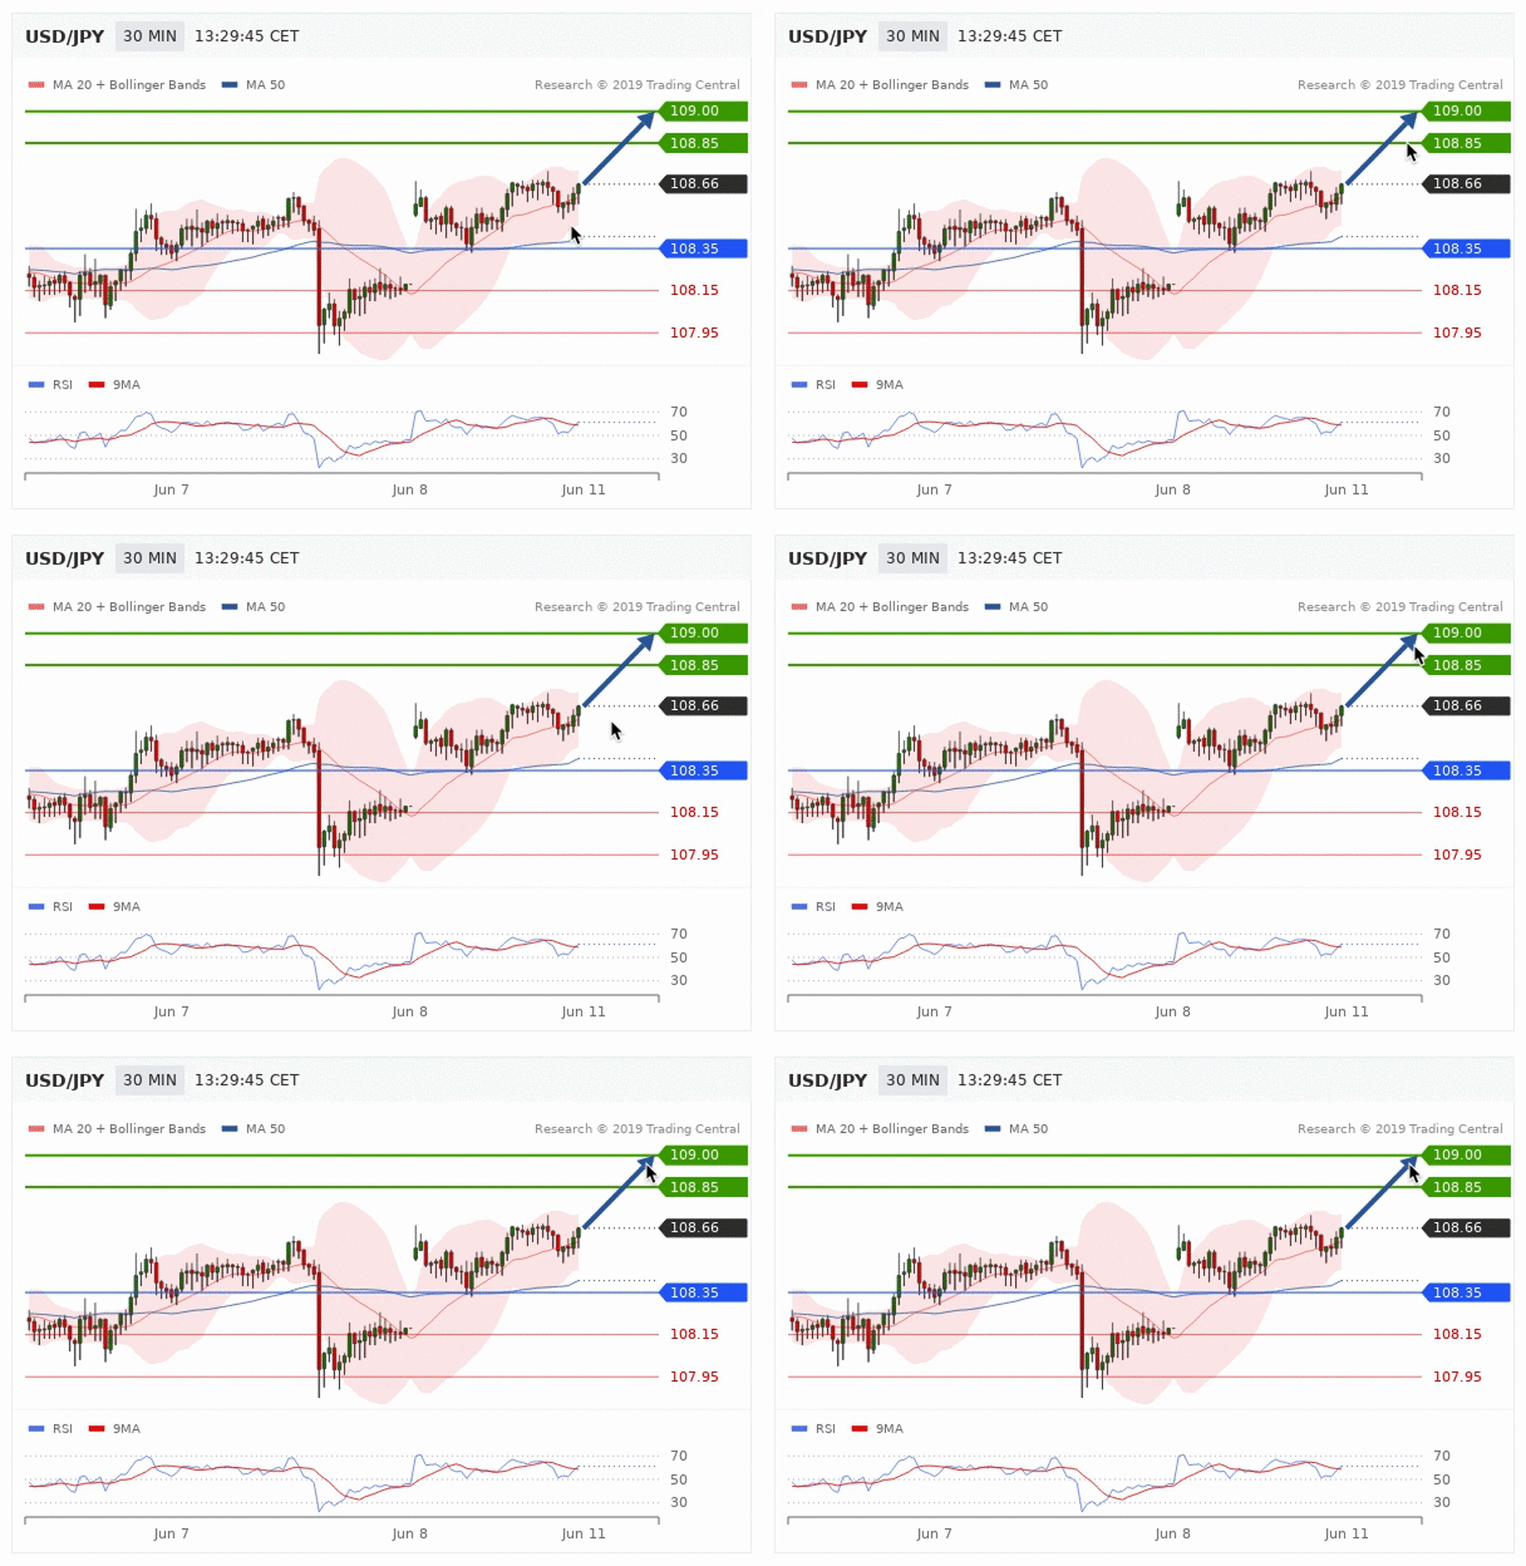
The bold blue arrow gives an immediate and clear sense of direction. In this case, the anticipated scenario is that the price may rise.

The anticipated scenario is only the preference as long as the price remains above this blue pivot line. If the price crosses the pivot line, the alternative scenario kicks in and prices are expected to go in the other direction.
Stops help you preserve capital
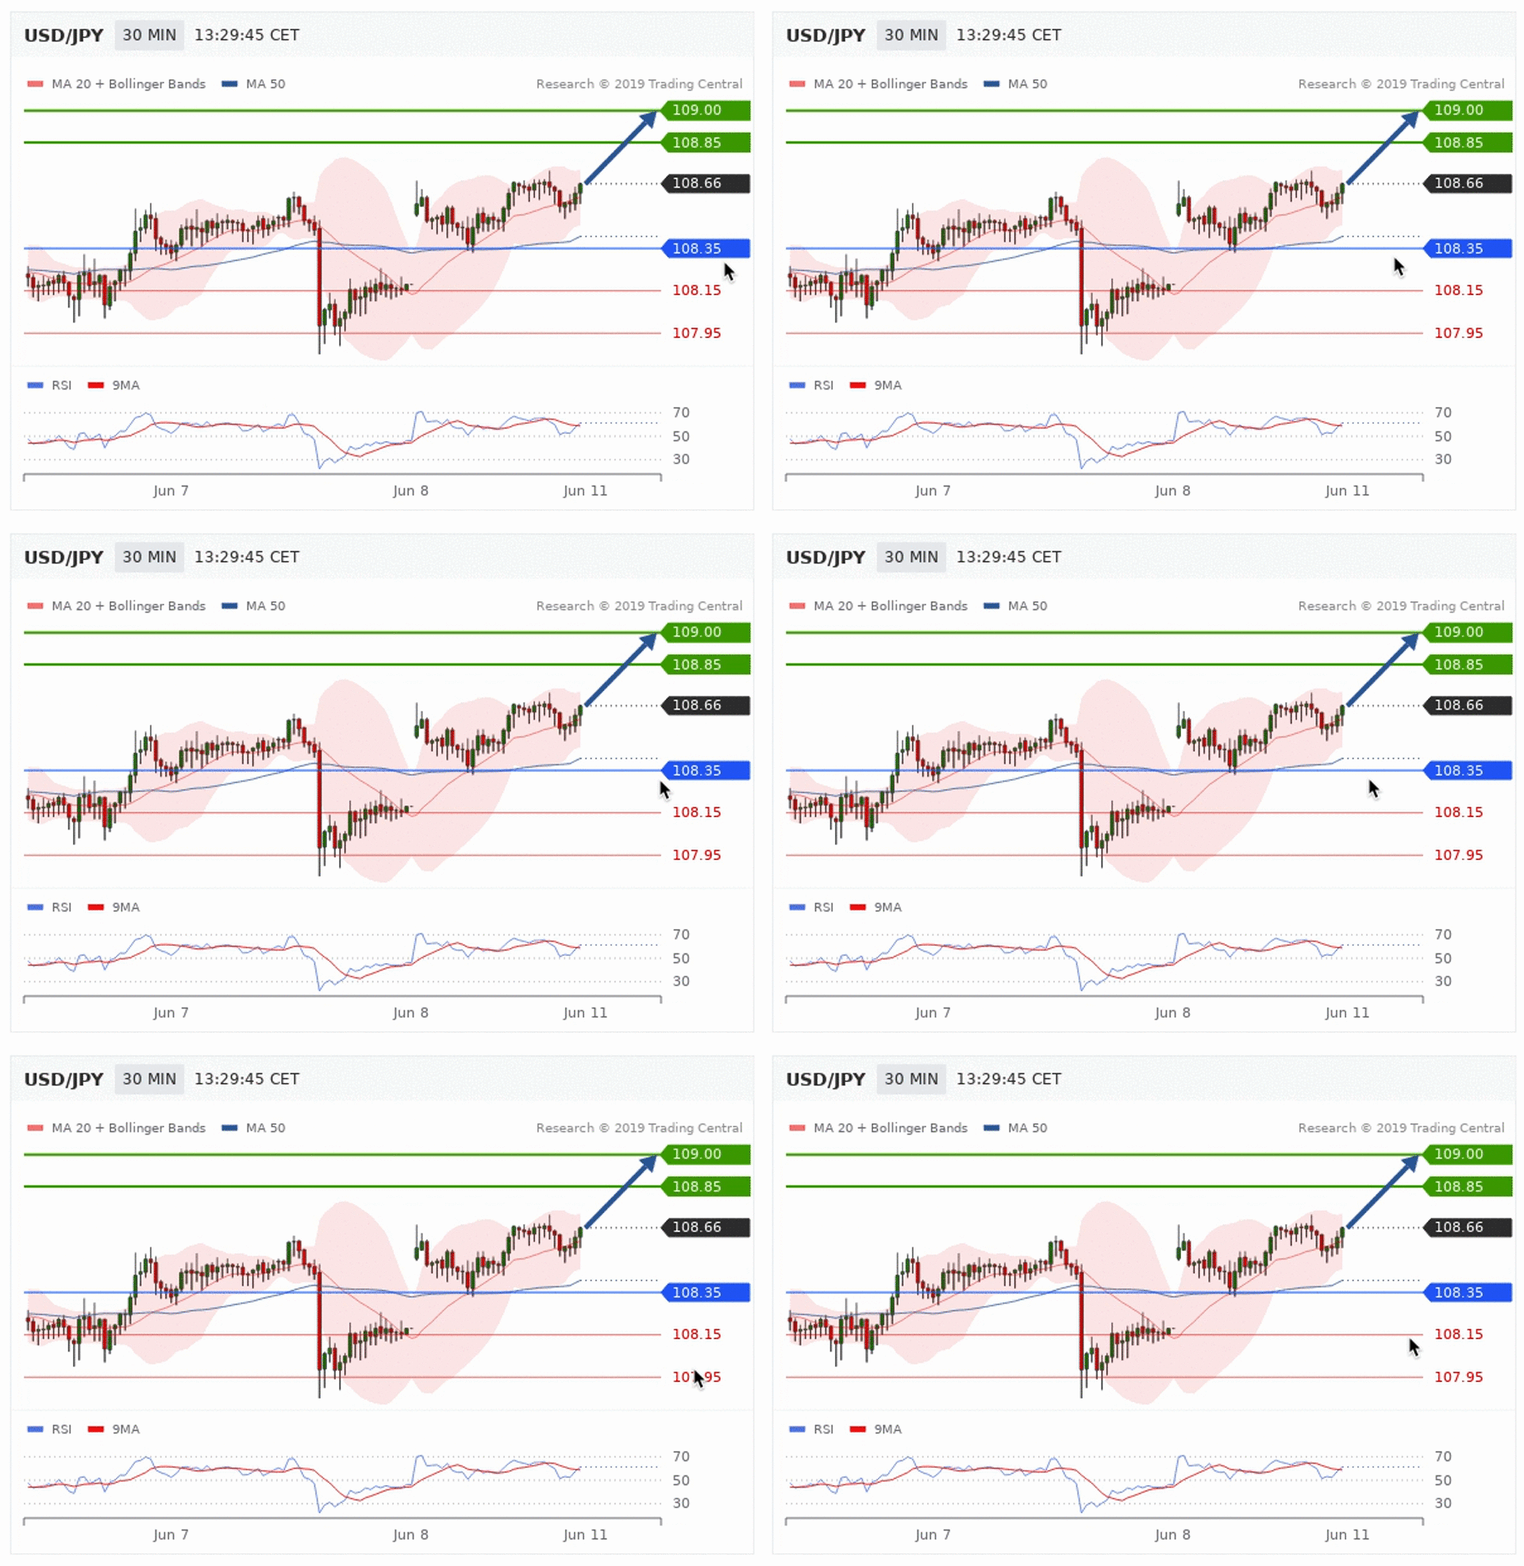
Our trading customers often use this pivot level as a stop price to protect their position. Hitting this stop means the reason for being in the position no longer exists, so they close their position.

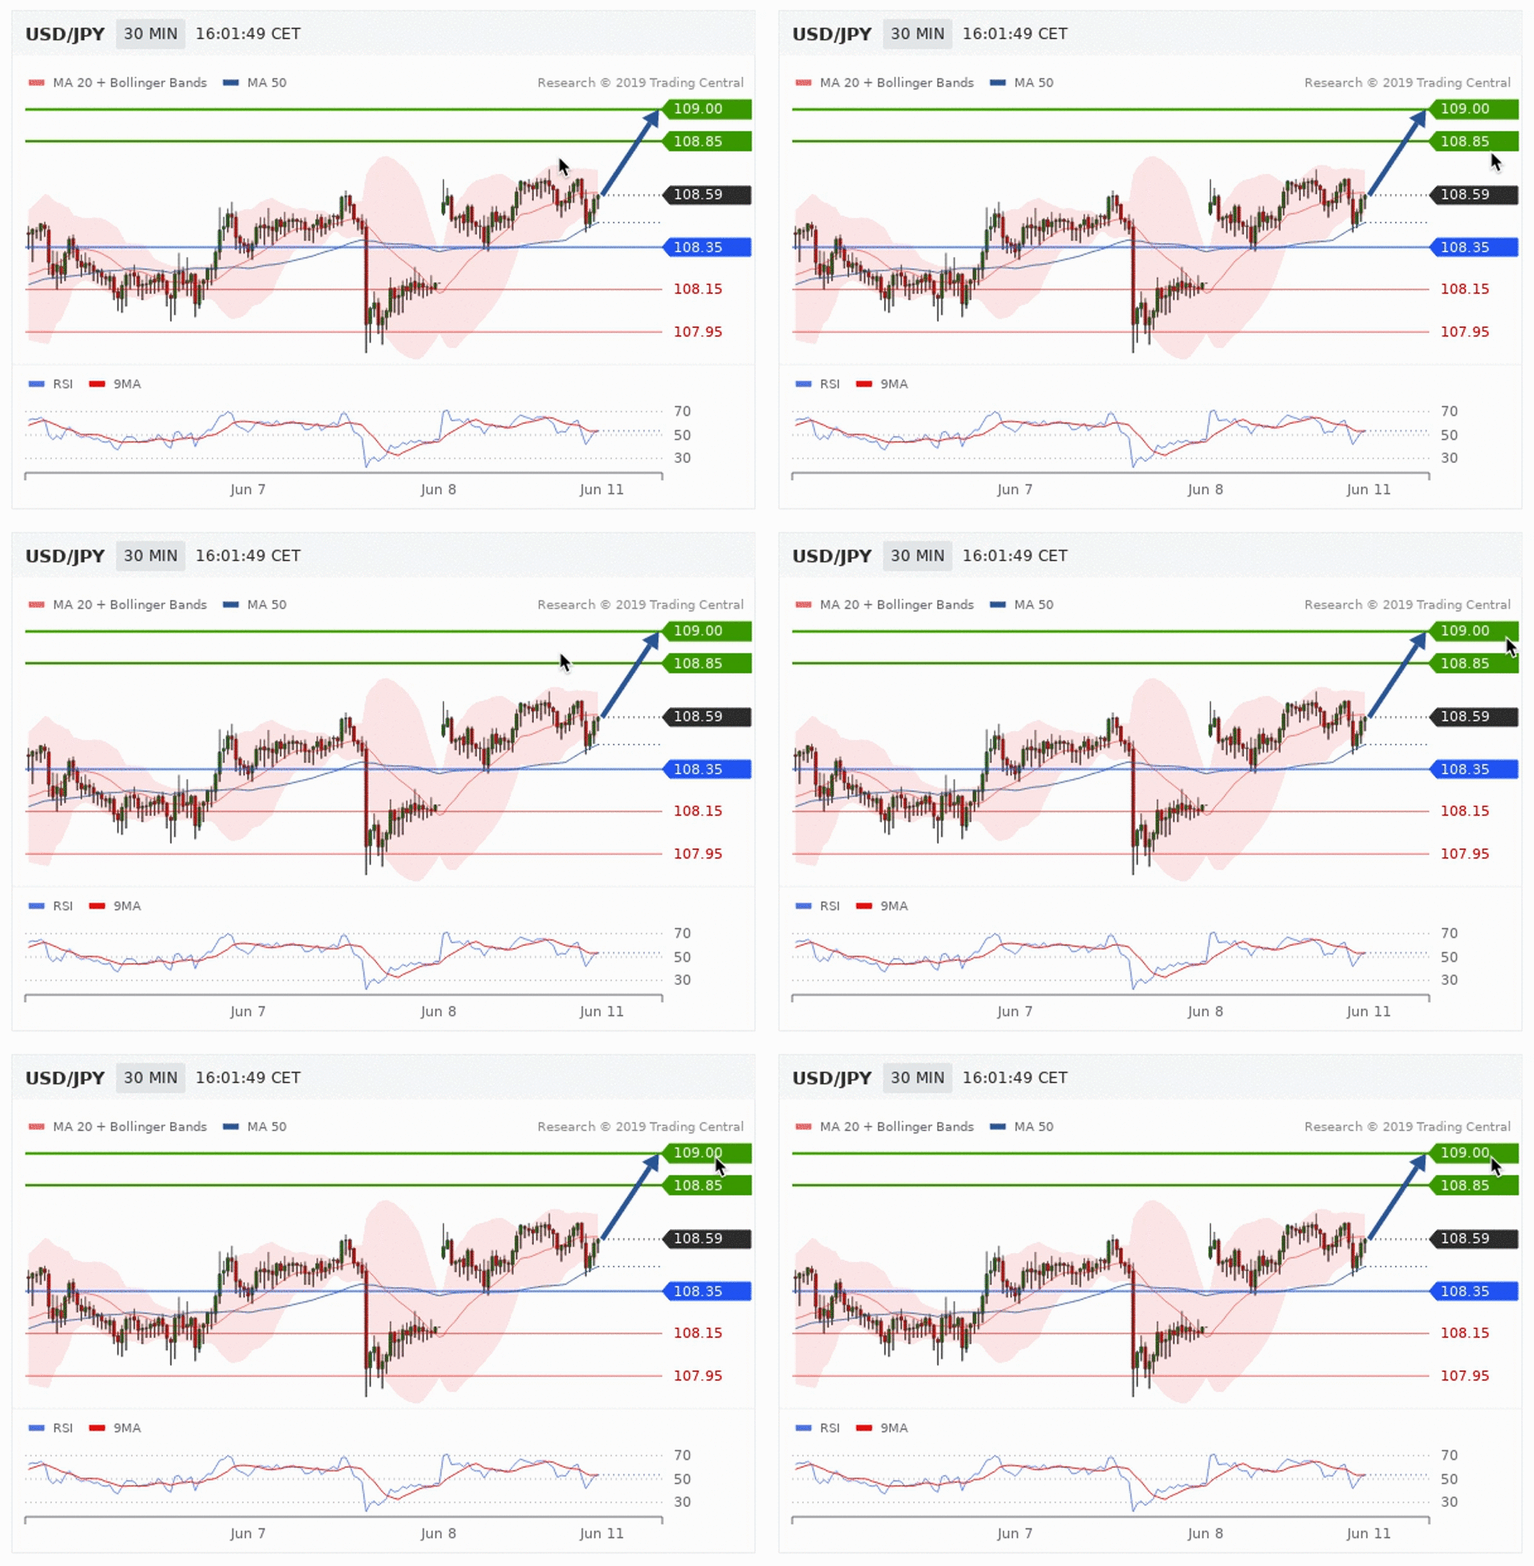
Now, stops are important but let’s also plan to exit with a profit! For this rising price situation, we offer two resistance levels to use as targets. A typical approach is to close half the position at the first target to lock in some profit, and close the other half of the position at the second target level.

This website is not directed at EU residents. Please let us
know how you like to proceed.
We have detected that you are visiting our site from an unsupported country. Please be advised that we don't offer our services to residents from your region.